
- project
CNTraveller Navigation and Guides
- my role
Information Architect
- completed
June 2012
What we launched
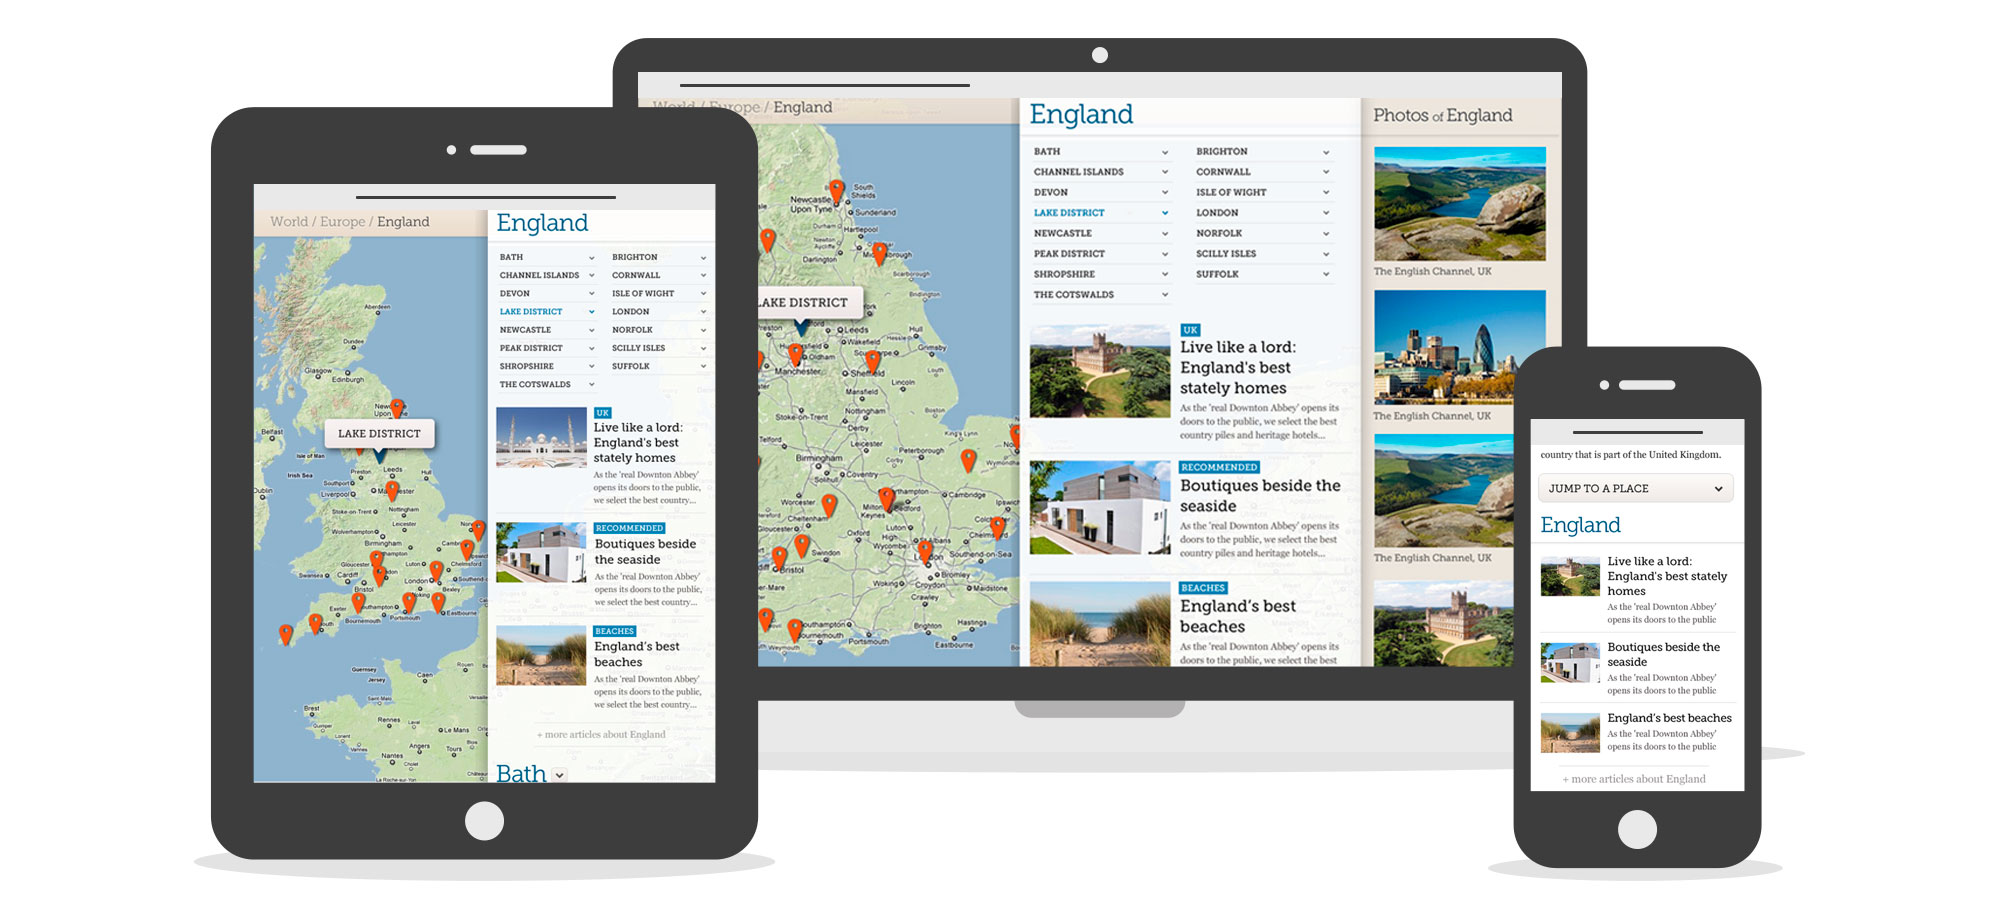 Screenshots of live site on a range of devices
My role in the project
The old guides pages only showed one article giving an overview and stats about the place in the guide. I wanted to build upon this by showing all location specific articles and galleries and use maps and photos to better illustrate the location.
To go along with the new Guides section we needed to tidy up the navigation, providing easy access to content by country and type of trip.
Navigation
With the help of my Junior at the time, Nathan Medford, we produced a research project. I wanted to gain an understanding of how users were using the CNTraveller site. Using data from Google Analytics we delved into a series of key areas including List page importance, page views from different devices per hour, page views in each section per hour, temperature of locations searched for by season and breakdown of arrivals. Using ClickTale we also used heat maps to evaluate how each section of Guides pages were being used
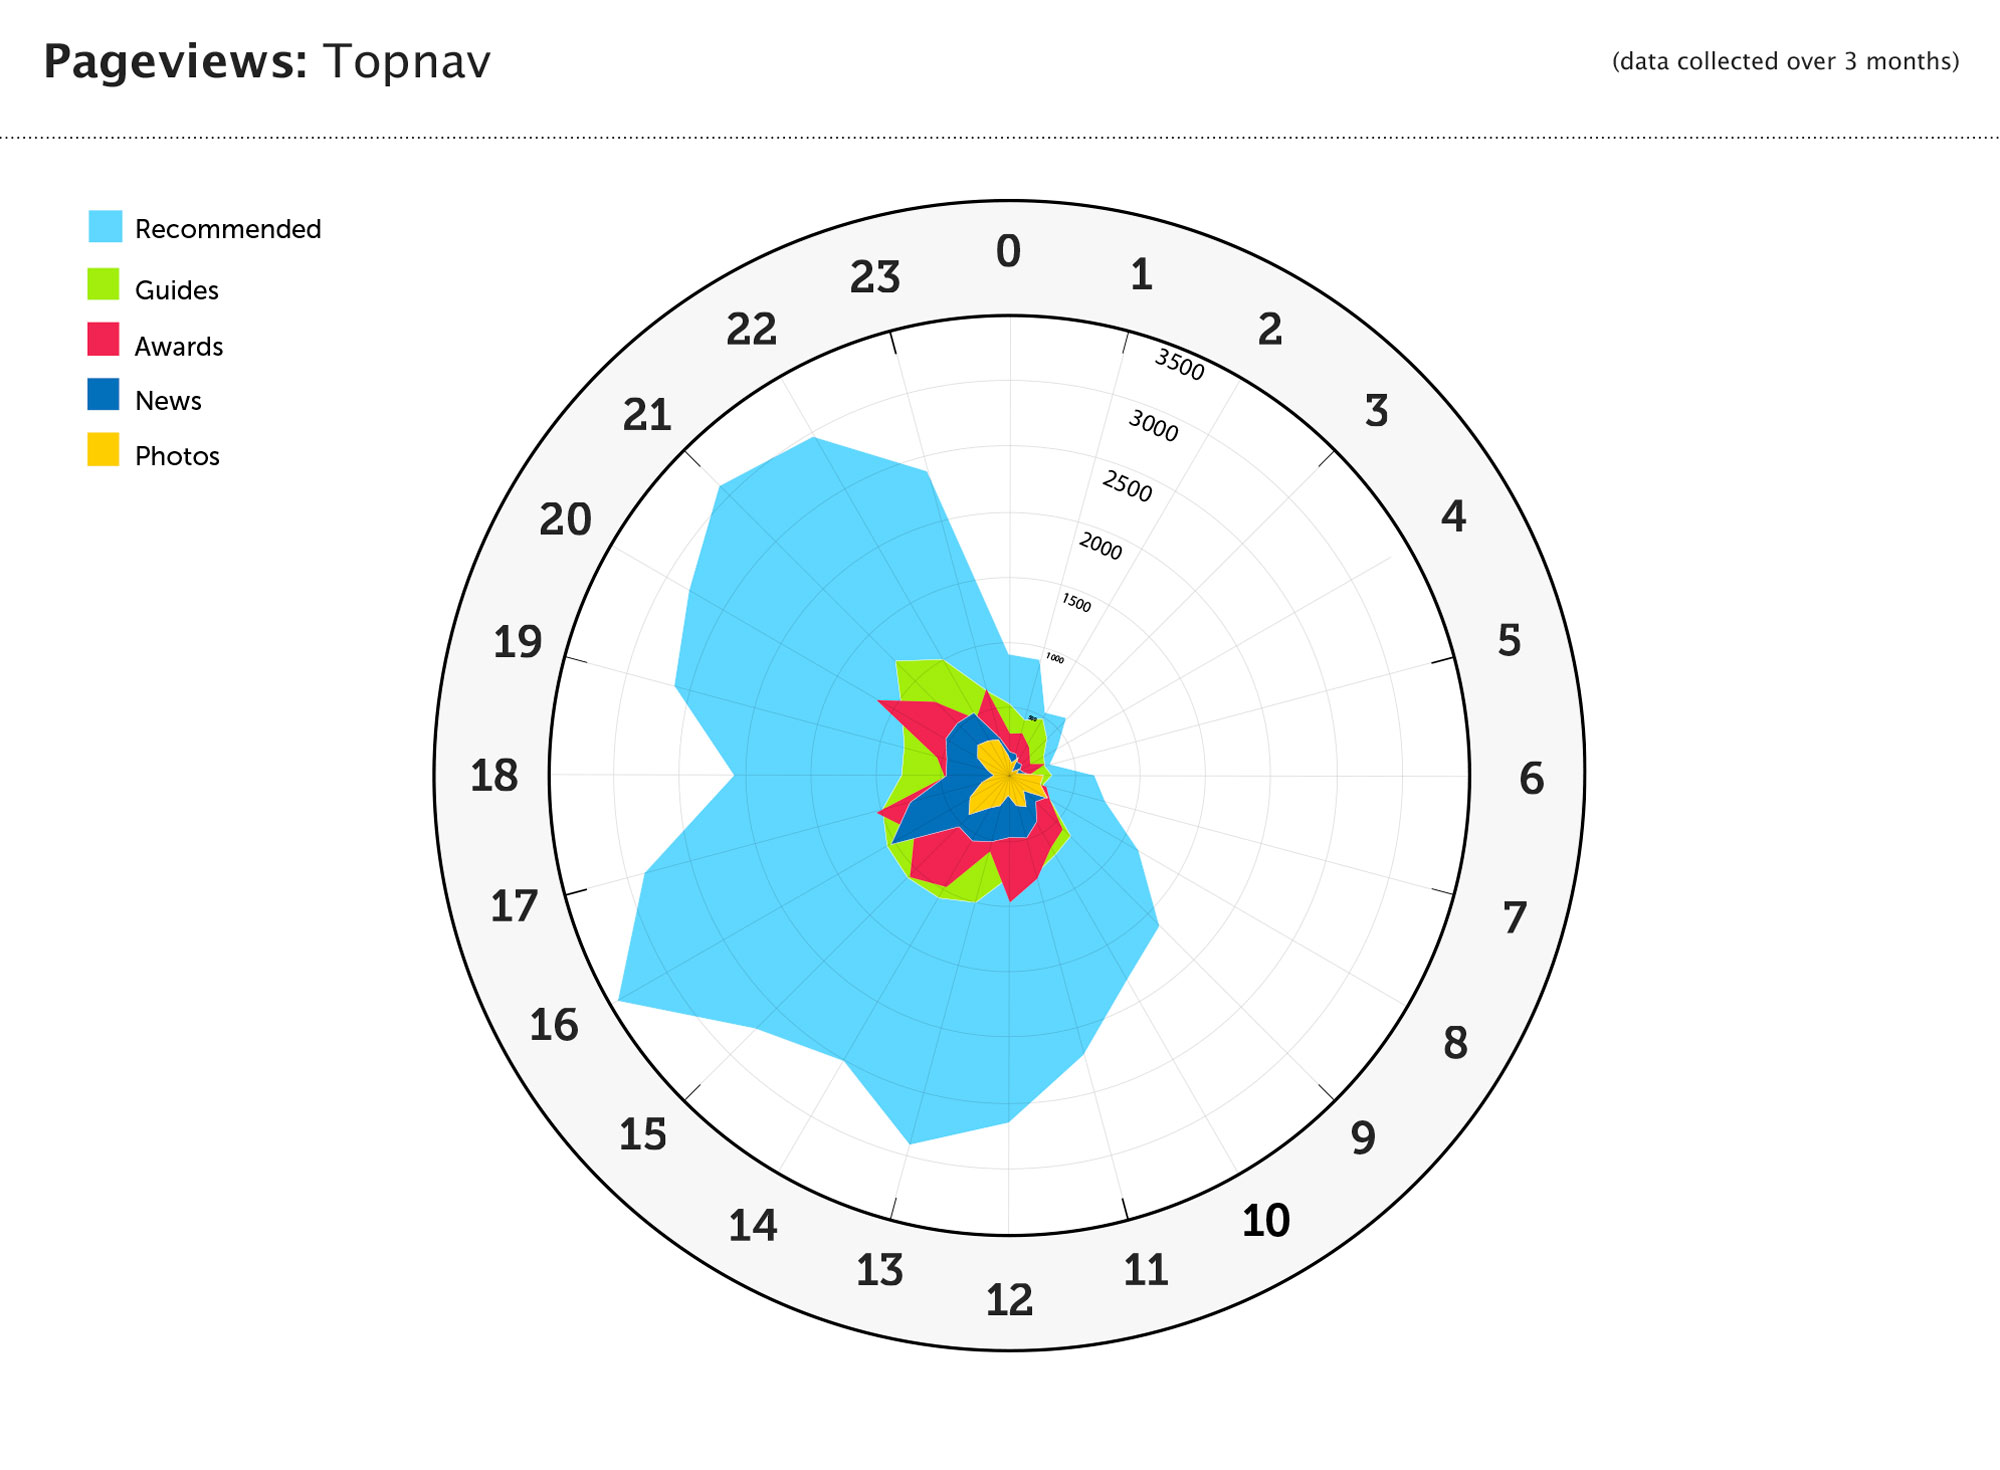 Pageviews for top level sections by hour in the day to see how popularity of sections at different times of day
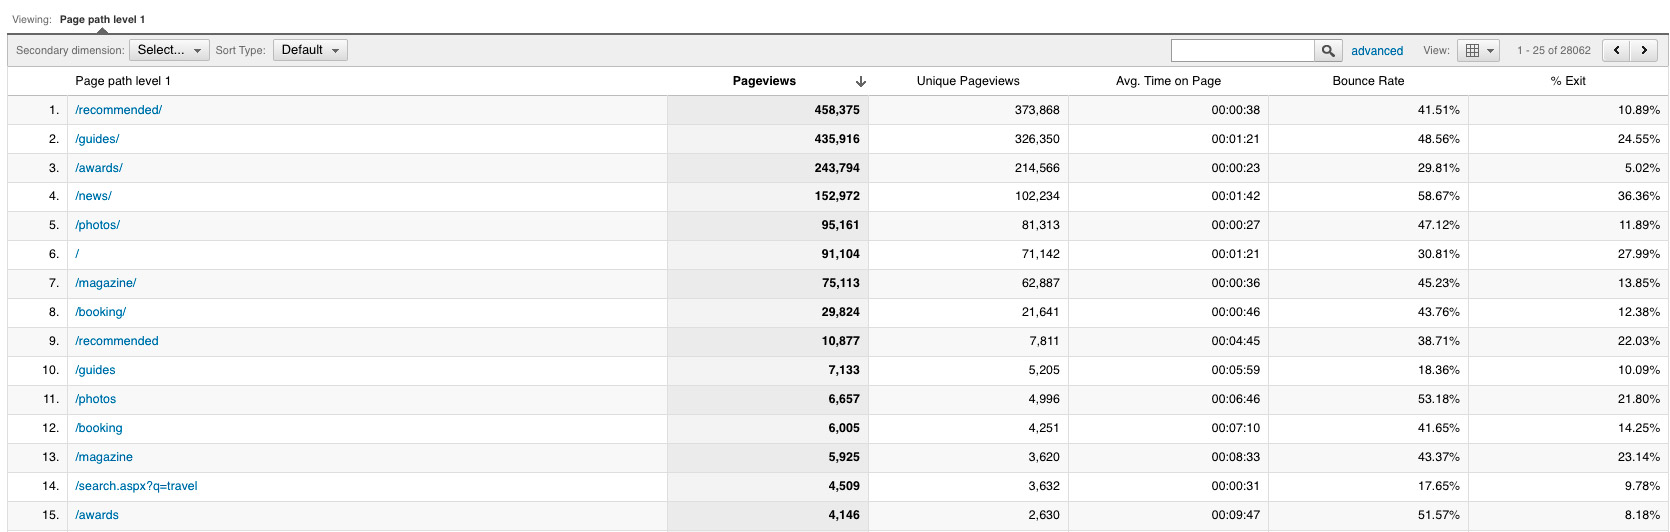 Screenshot from Google Analytics, popularity of top level sections over a month. Guide and Recommended sections are most visited
I ran a card sorting workshop with the CNTraveller editors to delve into the navigation structure. We split the navigation up into two parts, the Top Level and Type of Trip. Based on how much users were searching within CNTraveller we felt it would help users to show a series of trip types in the navigation.
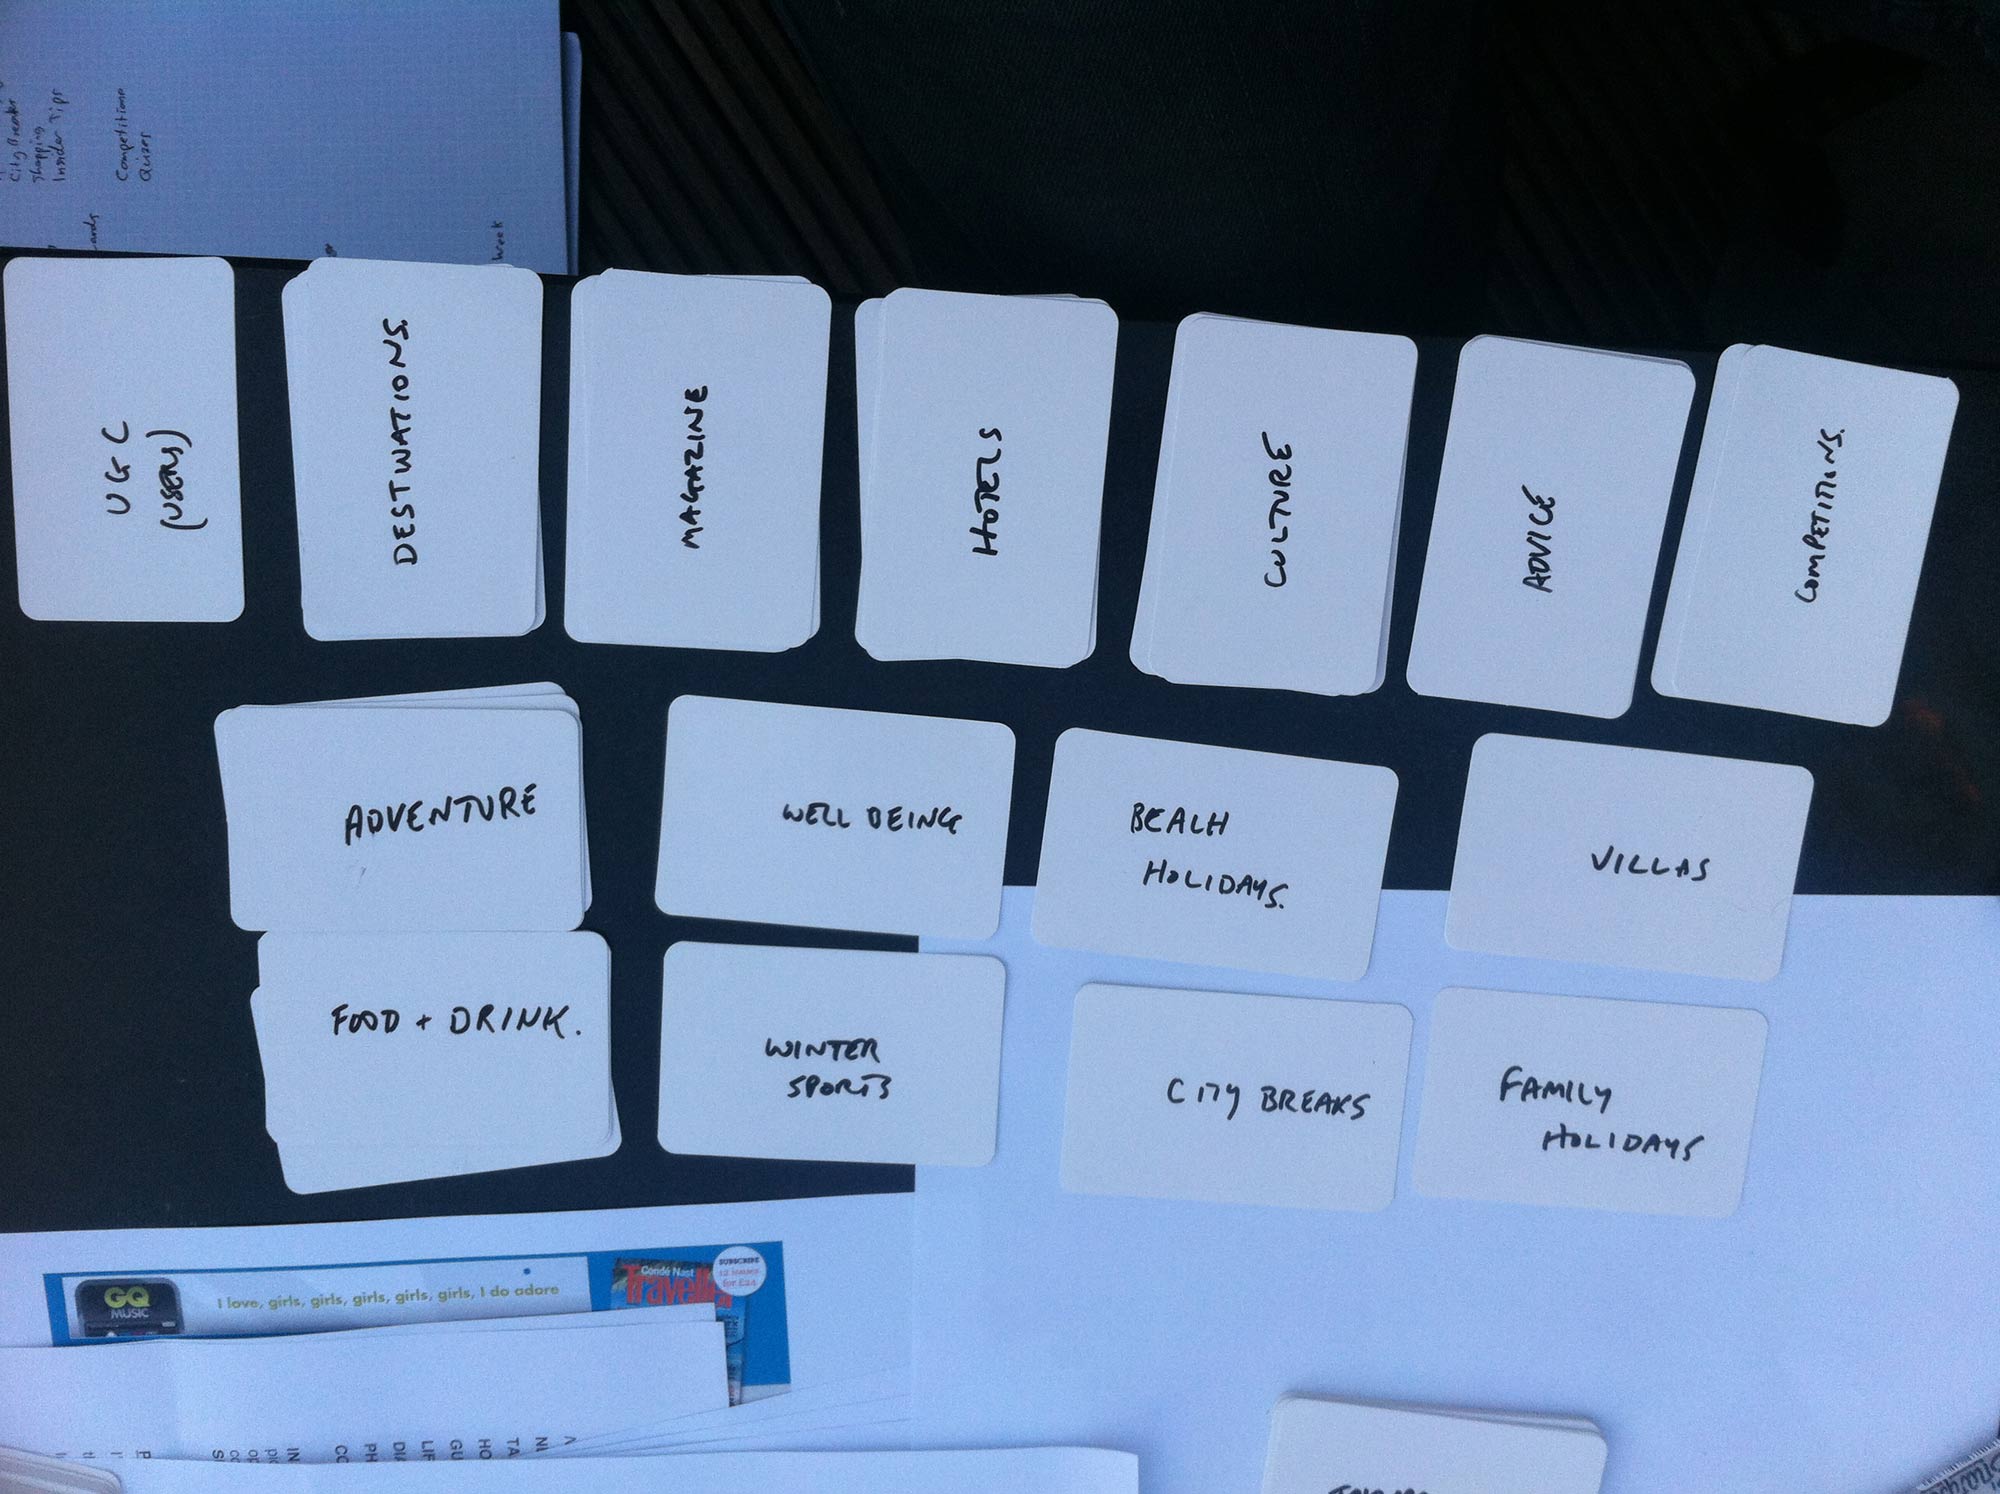 Results of a card sorting workshop I ran with the CNTraveller editors
After the card sorting I produced a diagram documenting the new navigation structure.
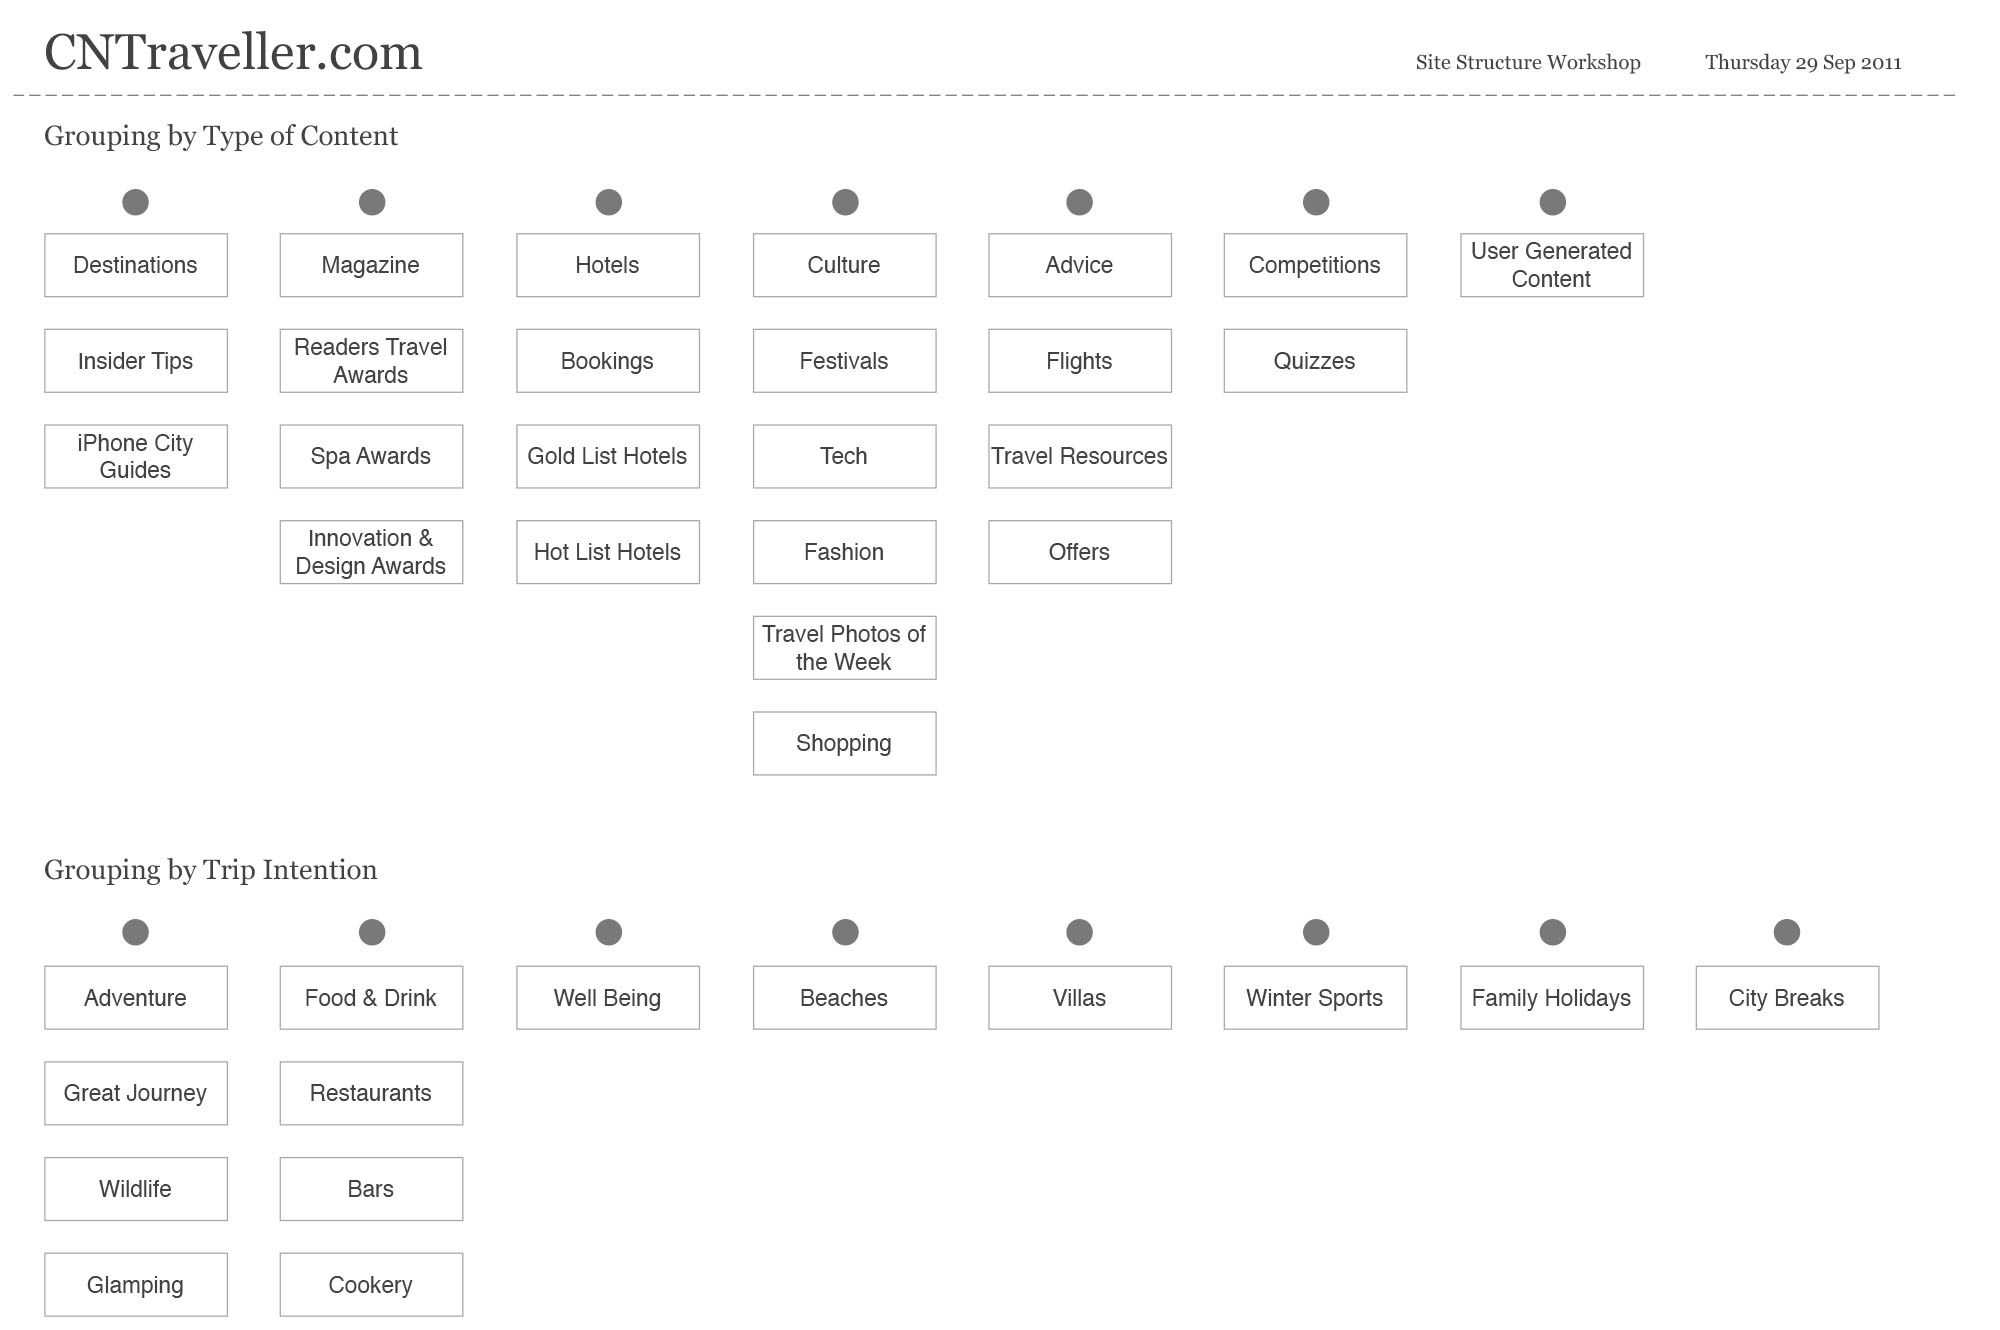 Documenting the new site navigation
Guides
I needed to find out how feasible it was going to be to combine articles and galleries into their respective guide pages. Was there going to be enough content? Was their going to be too much content? How varied was the amount of content between places? One of our developers performed an sql query on the database, returning amounts of content by section and location. I restructured this data to better tell the story. In the spreadsheet below you can see amount of content for each Continent, amount of content for countries(children) in that content. Then below is the breakdown of each country.
On a countries guide page I wanted to have a map showing the cities/towns we had content for. Using a geomapper tool I mapped every place we had content for. I did this with a world view and also by country. My main aim was to see if they’d be too many pins to be able to differentiate between places. When designing I find it helps to use real data as much as possible.
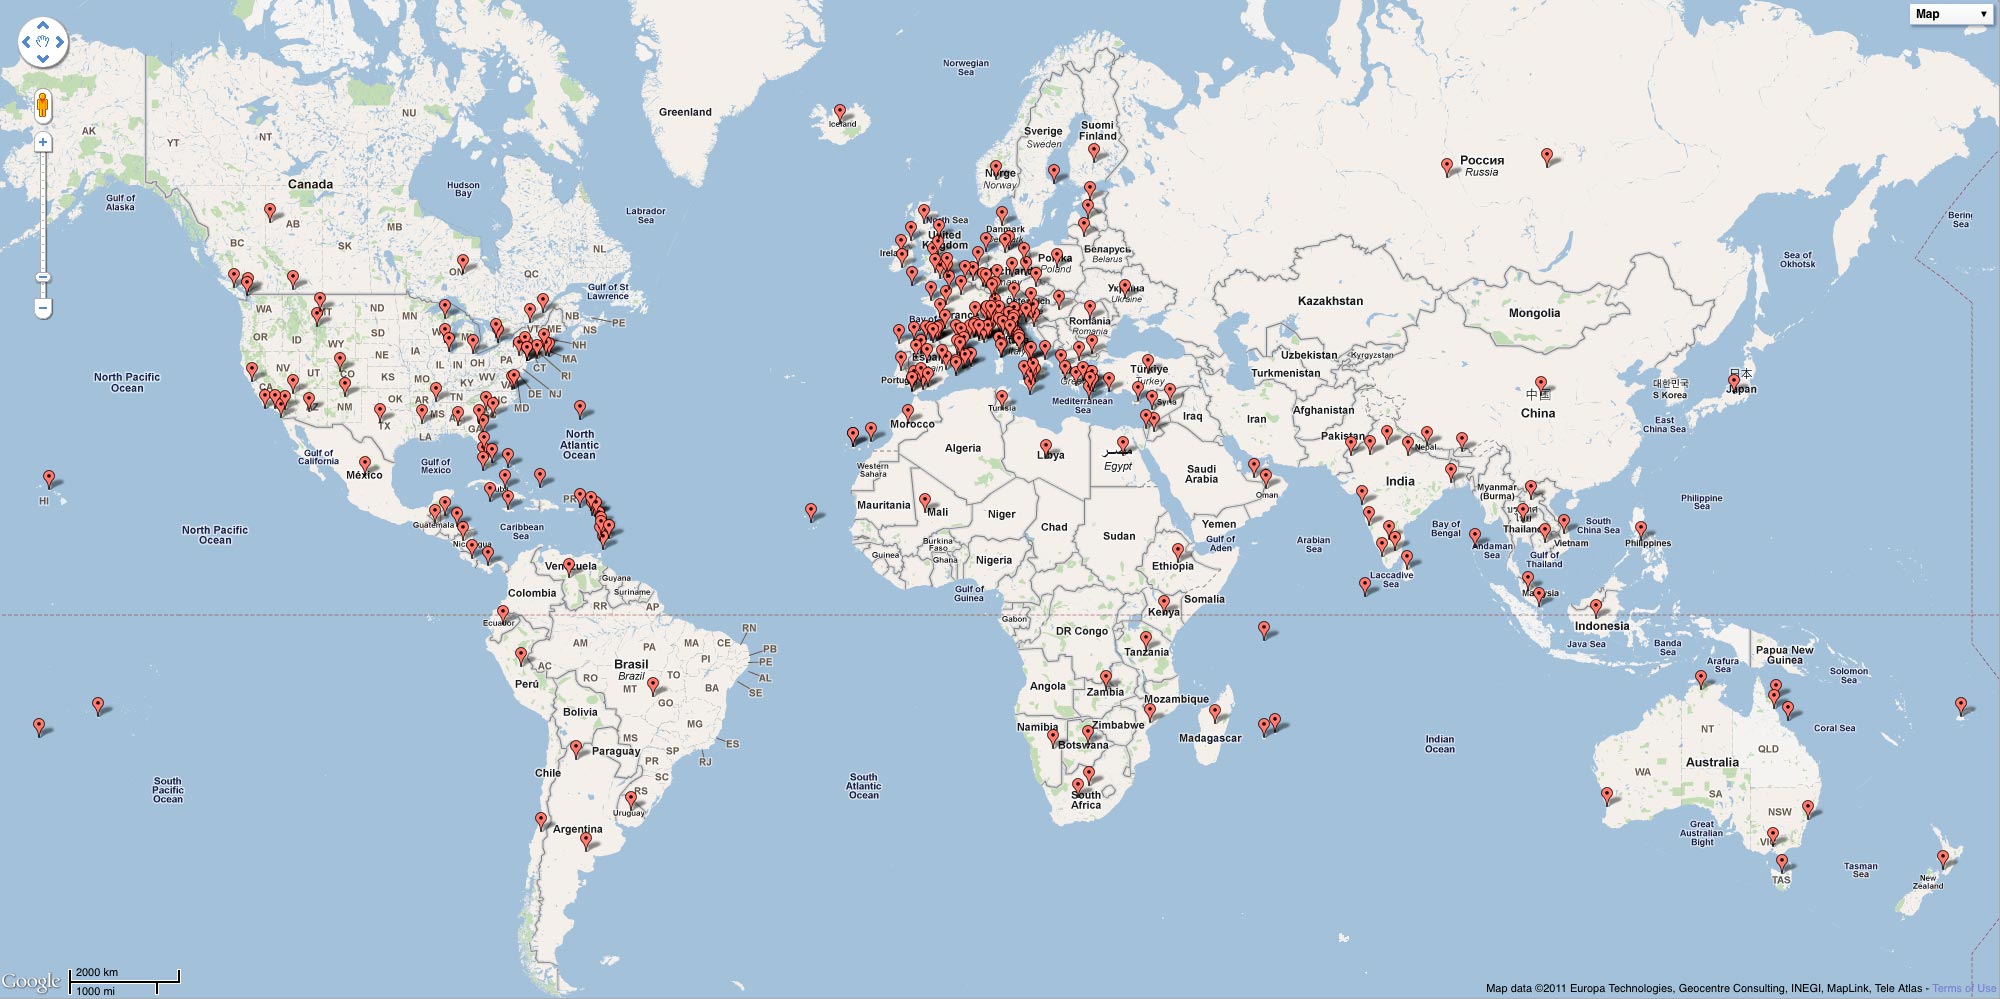 Map of the world with a pin for every place CNTraveller has content about
Knowing the data was all there and would be able to support the concepts I had, I began wireframing. I produced wireframes for the World, Continent and Country pages, each with fully responsive layouts.
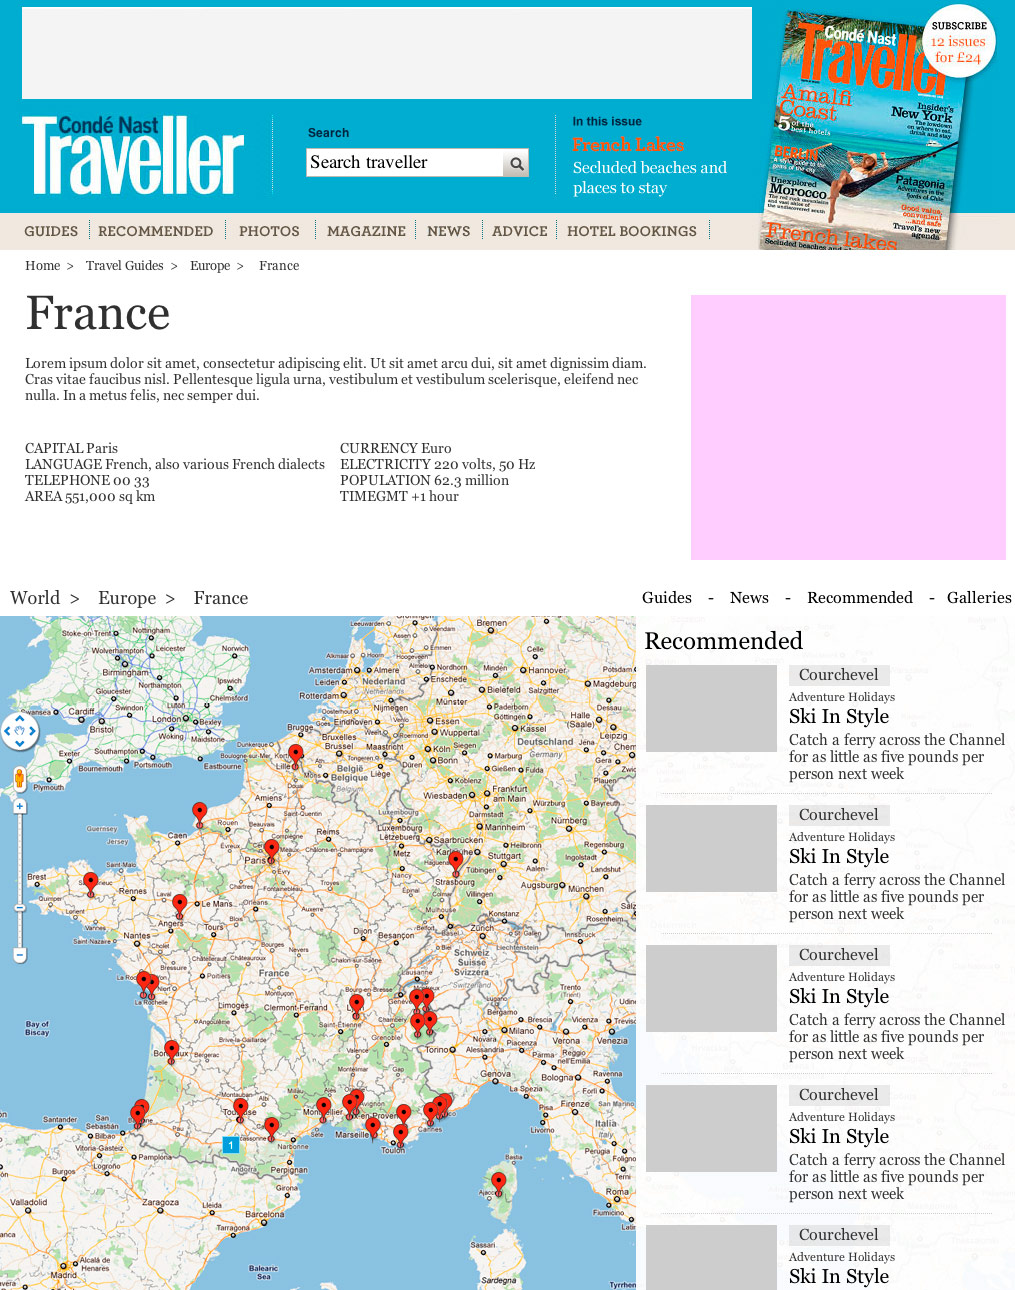 Wireframe of the Country Guide page
With a developer we built a simple data first prototype, testing the data and how it looked and felt. At the time we didn’t have large monitors in the office so I went round the corner to the Oxford St Apple store and tested out prototype out. It felt amazing using it in full screen!
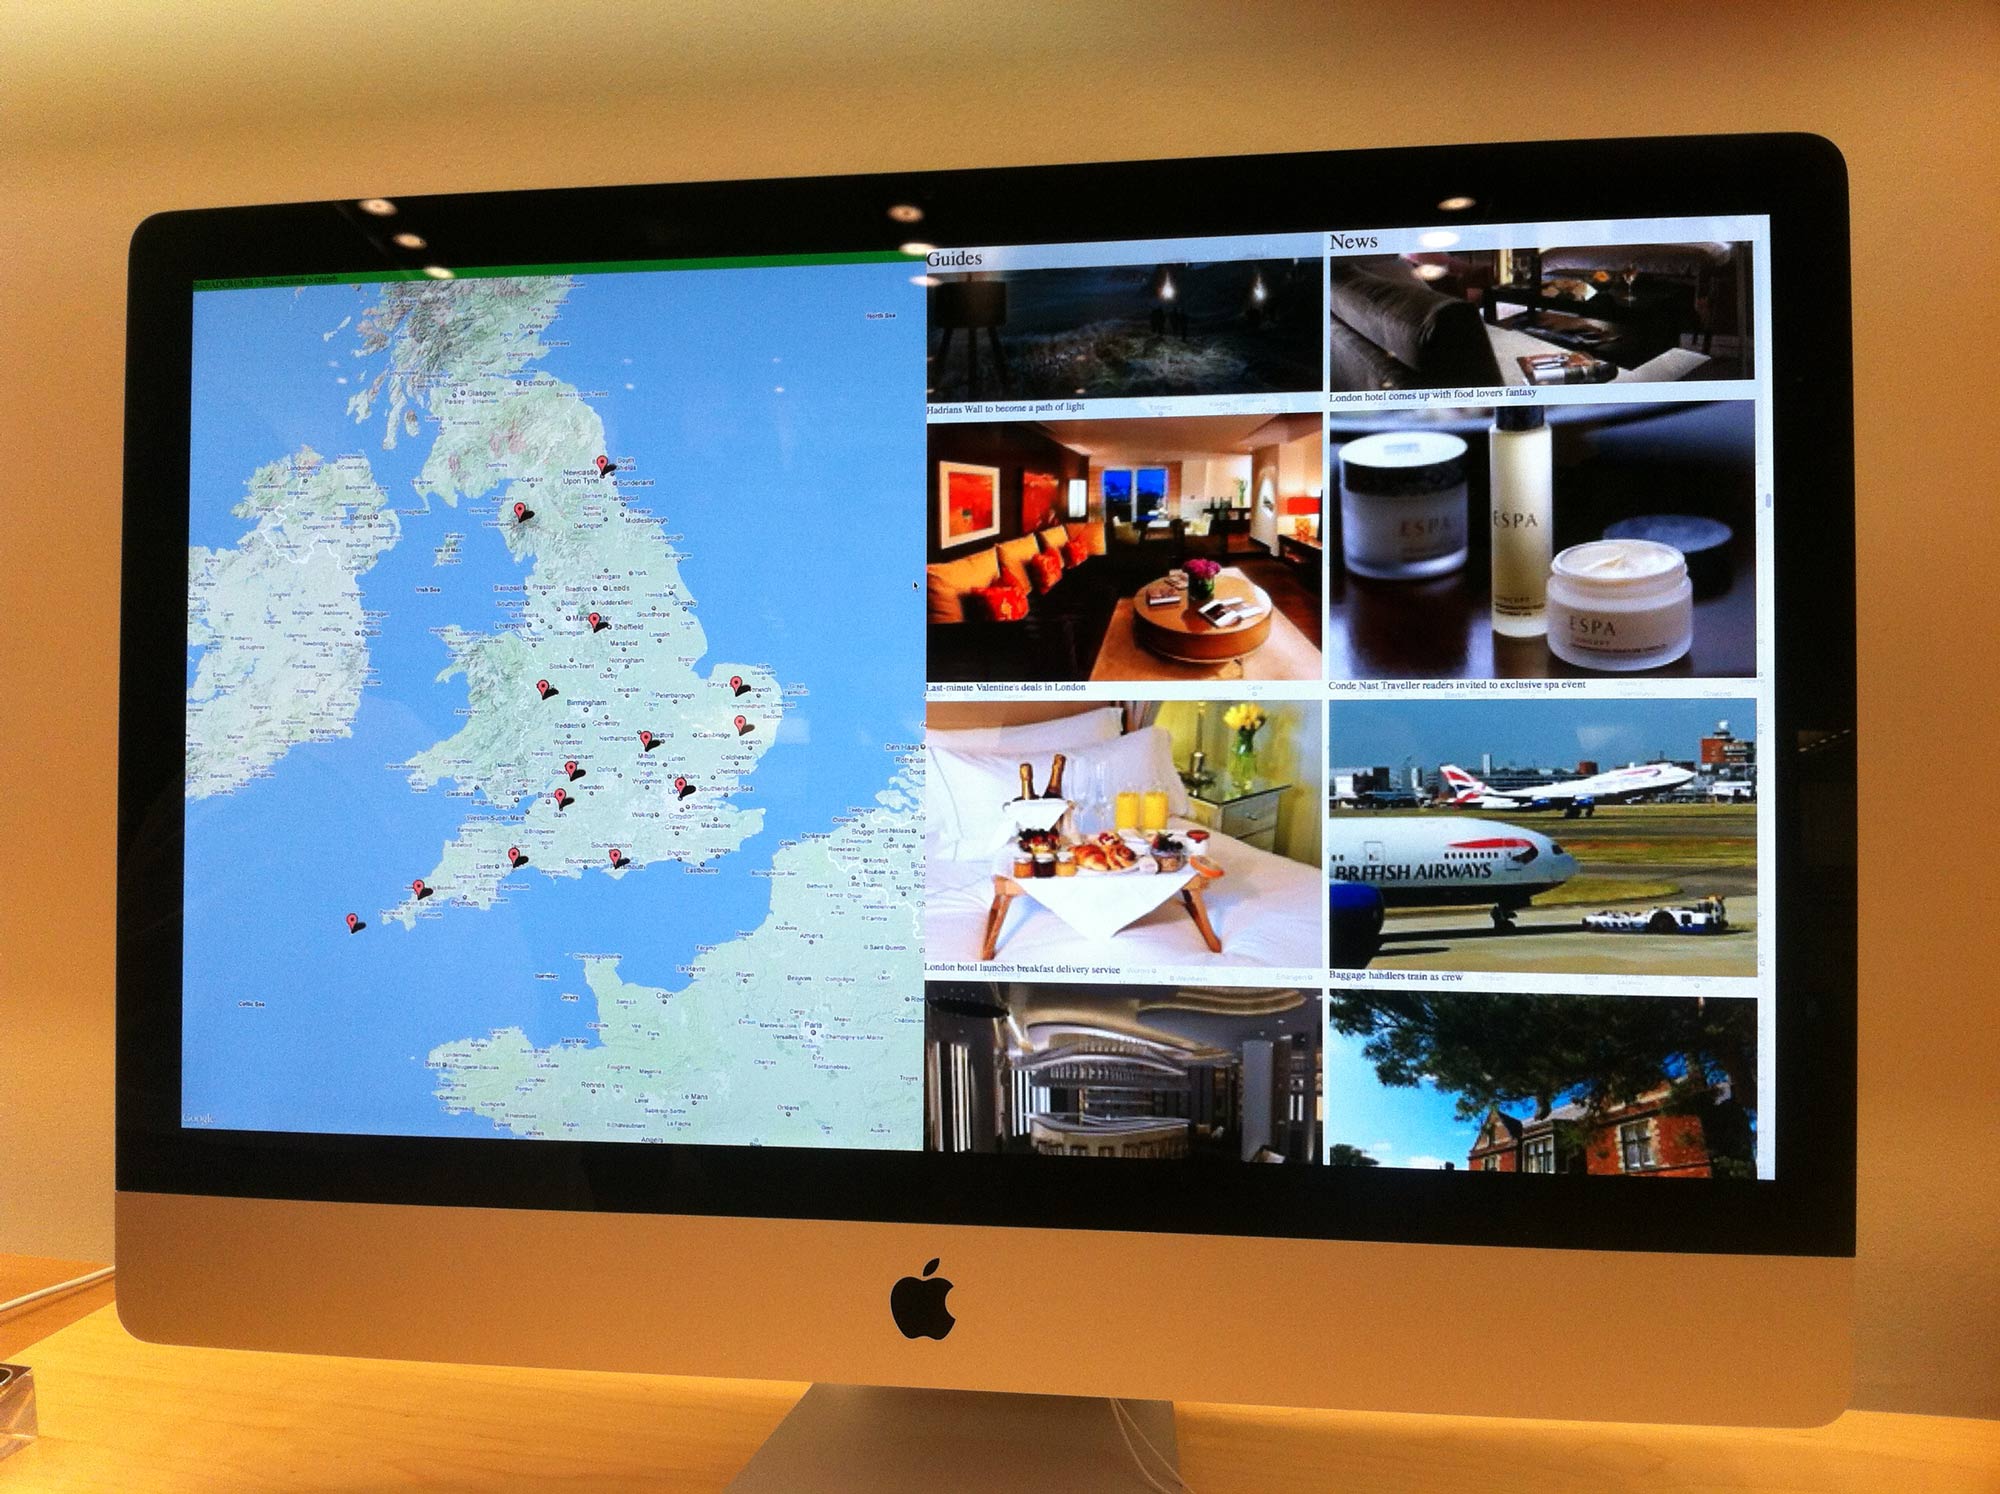 Prototype of the England Guide page, testing in an Apple store
Results
6 months after we launched the Guides section we did an analysis project to see how it was working. One of the things we were happy about was that people were still able to get to the original destination guides, and we had opened up articles that wouldn't have been found before.
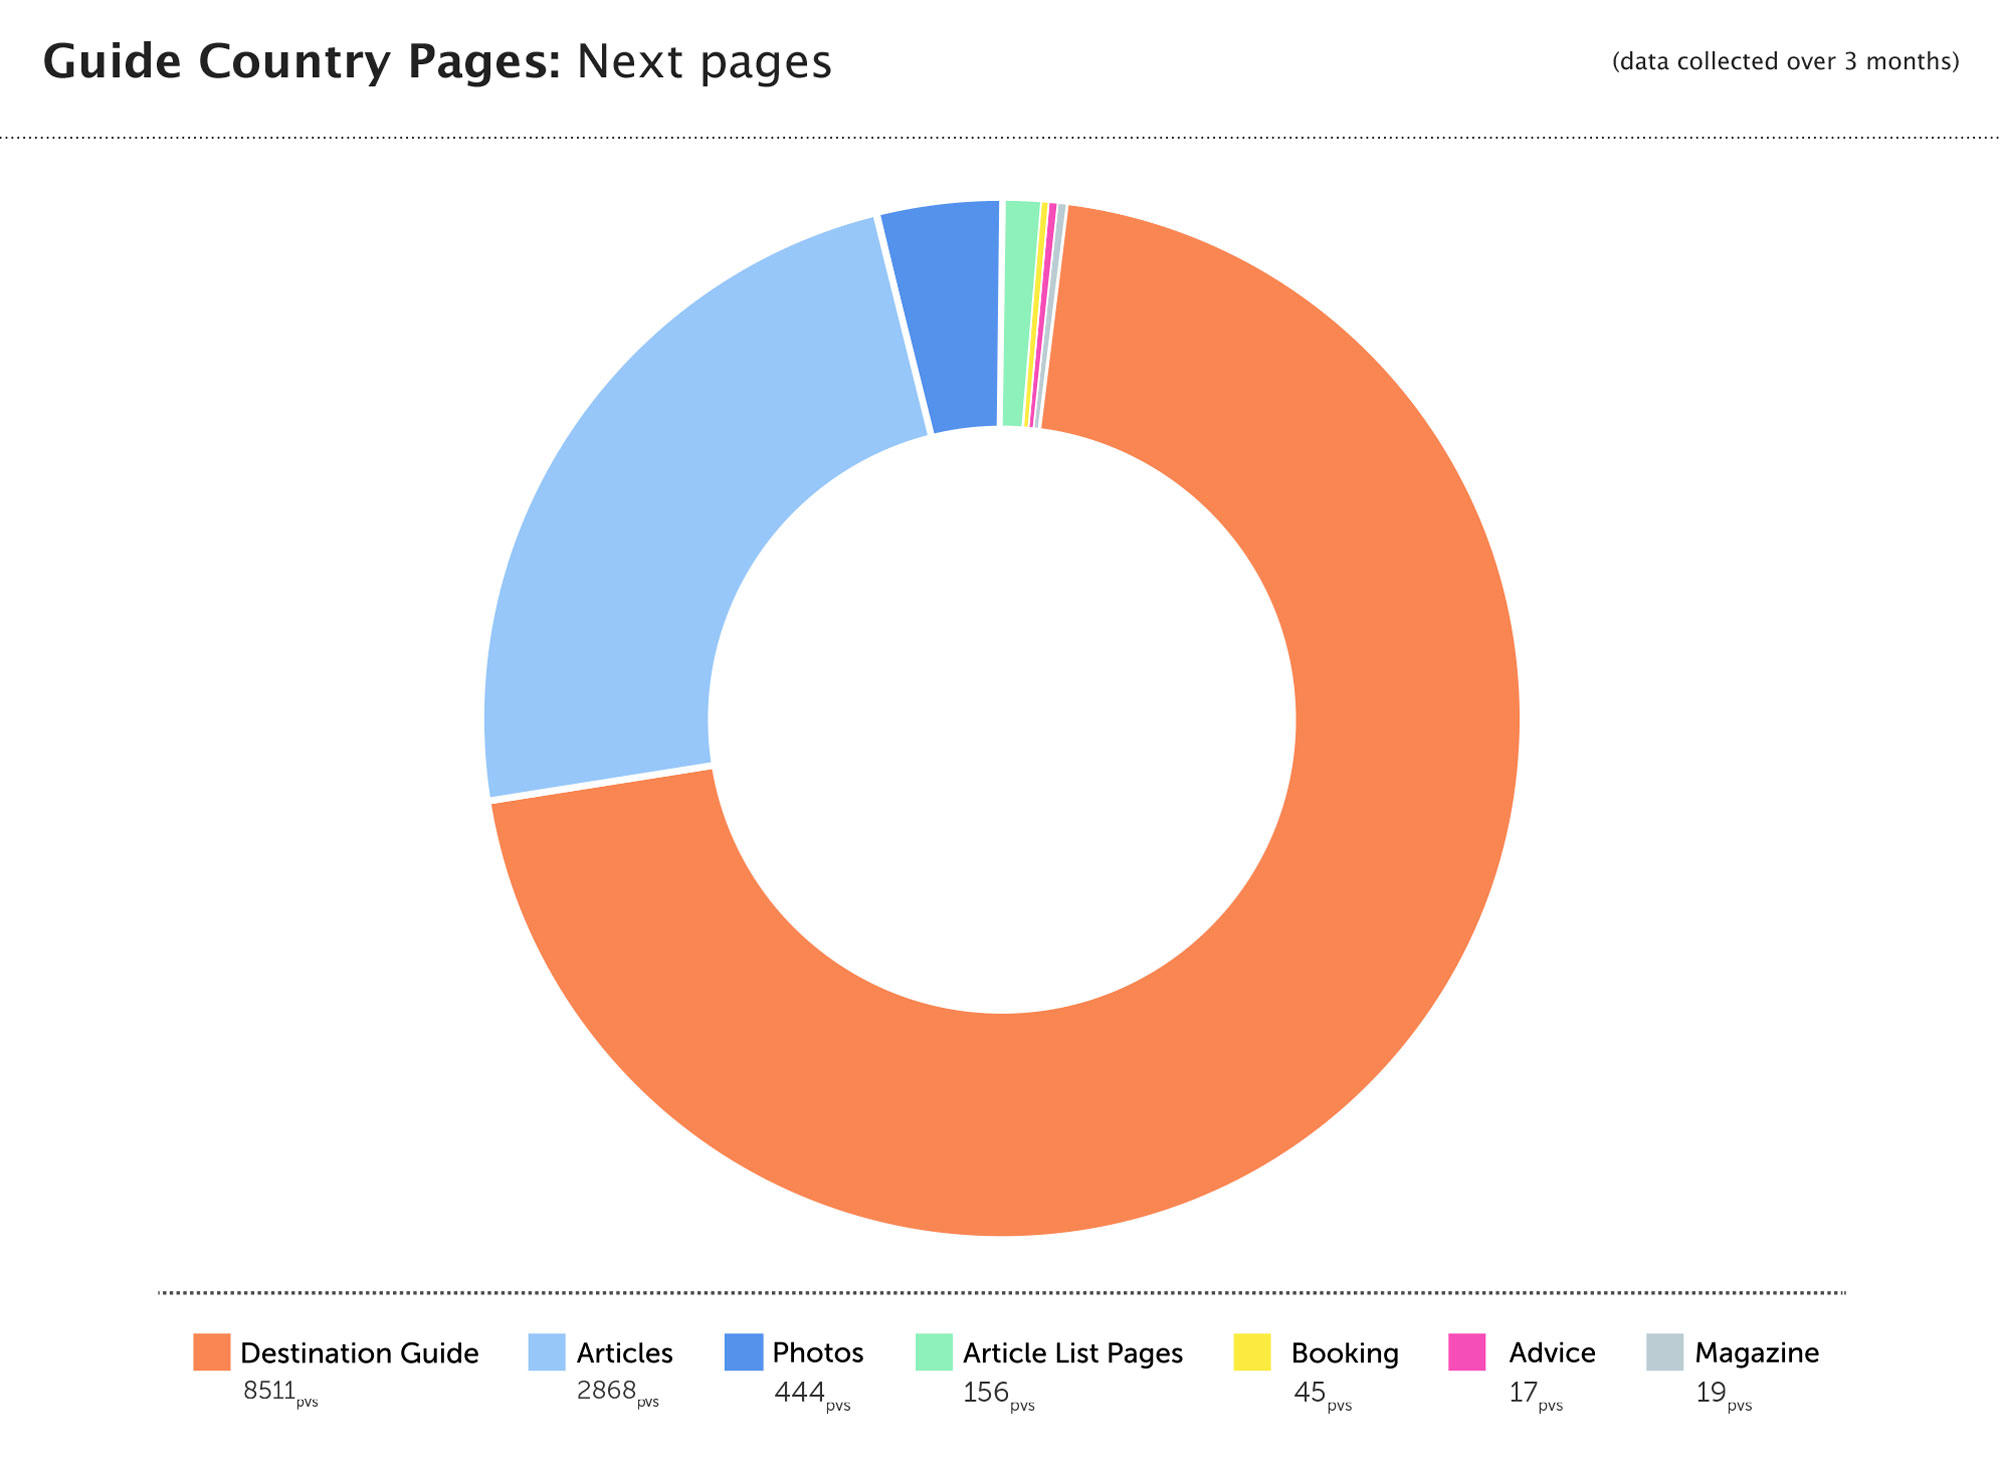 Looking at which pages users were going to after being on the Country Guide page
by Gareth Williams
I pride myself on empowering teams to turn complex problems into simple and engaging experiences, through a multidisciplinary skill set and 10+ years of industry experience. If you'd like to chat please get in touch.